It’s been almost two months since the release of our spreadsheets system. Spreadsheets allowed you to craft custom reports featuring more than just numbers. With charts and courts, you were free to create advanced visual prints, fine tuned to your teams needs.
Just recently, we’ve expanded our system to tablet bench mode, allowing you to show those same fine tuned reports to your staff, during an important match.
With update 1.12 we are expanding the possibilities of our signature VSCOURT function to give you even more options when analysing play directions.
Many ways to look at the data
The most important change to VSCOURT is the ability to select your data visualisation. Here are all the available options, old and new:
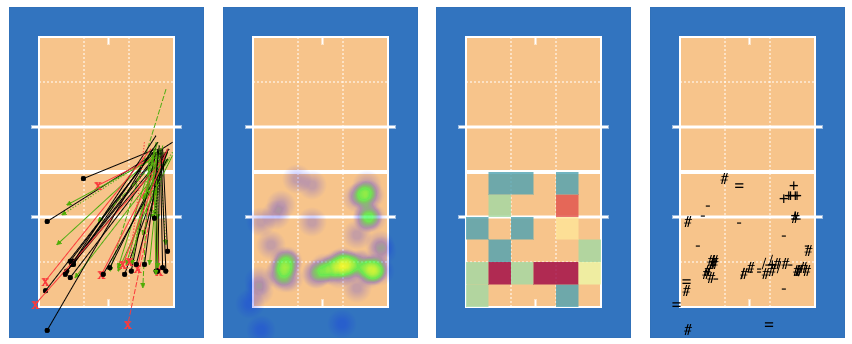
As you can see, every view from heat maps report is now also available in spreadsheets. As a quick reminder, those are:
- Arrows – connecting play start and end point, changing their colour based on point won, point lost or continued play.
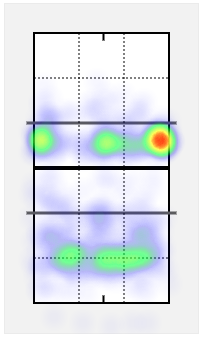
- Heat maps – a fantastic visualisation when searching for trends
- Sub-zones – a version of heat map that does not require you to mark precise play locations
- Effects – Showing effect symbols in each play point
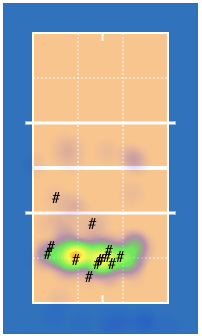
This is already a big step forward from previous system, that only offered arrows as a visualisation method. Our improvements do not stop here, as you are now able to use more than layer at once. Here is an example serve heat map, with aces marked as well.
Select the point of analysis
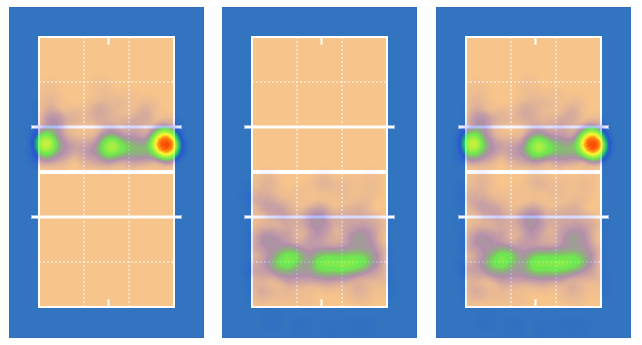
While arrows always showed both start and end point of a play, this is not true for all the new visualisations available. With heat map for example, you need to choose which one you want to display. This can by done with a simple configuration option that allows you to select start, end or both points at once
Additional display options
Prior to this release, our courts offered a scale option that allowed you to adjust the court size. This option is still available in 1.12. We have added one additional tweak that may be of interest to you, and that’s a print colour scheme for courts. In print mode courts can be sometimes more readable, they also use less ink when printing.
How to use it
To use all the new features, you need to be running VolleyStation Pro in version 1.12 or later. After the update, you will find a new spreadsheet “Courts tutorial” automatically added to your spreadsheet list. This spreadsheet shows all of the examples above, and more, to better explain how to use the new supercharged VSCOURT. If you need to get this example sheet again, it will be always available under the link here
To give you a quick idea of how all this works, the general VSCOURT syntax looks as follows:
=VSCODE("filter", scale, "layers", "zones", "print")The simplest example would be something you already used, like directions of all X5 attacks
=VSCOURT("*X5")This court will default to arrows visualisation, just like it would in VS before 1.12. If you want to change things around, you would have to write something like this
=VSCOURT("*A","heatmap,#","end","print")This is a heat map, with all kills additionally marked, done for the end zone, with print colour scheme enabled.
Give it a try
Changes mentioned in this article, are already available to all VolleyStation Pro users. Just make sure, you are using VS Pro in version 1.12.0 or above. If you want to try VS Pro, then please contact us using the link below.