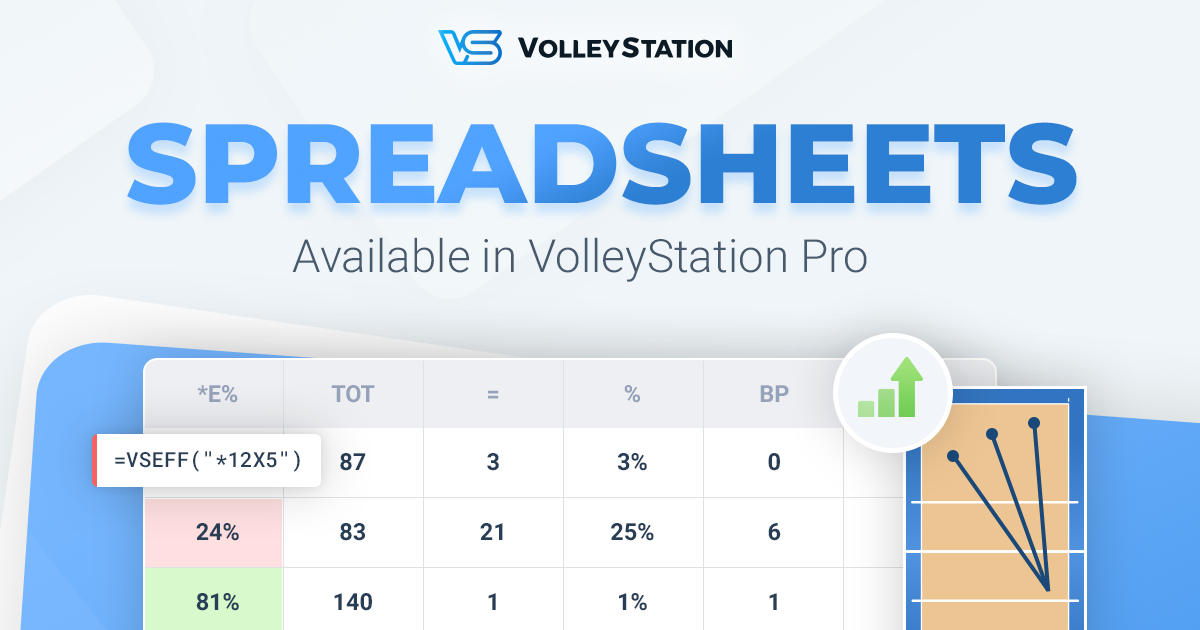
It’s been over a month since we’ve released an improved direction analysis through heat maps. That means it’s time for another update, and this time it’s just as major. With VolleyStation Pro 1.9 you will get access to our new spreadsheets module.
Spreadsheets available in VolleyStation are going to redefine how we approach custom reporting. We made it possible, to not only access raw numbers, with flexibility not previously available, but also embed data visualisations directly into your sheet.
Here you can see an example of what is possible with this system
Continue reading to discover more about this new feature, and learn how it works.
Easy to pick up
When designing this new module, we had two things in mind. First of all we wanted to keep our spreadsheets as close to typical workflow as possible. If you worked with any other spreadsheet software before, you will find it easy to get into our formulas.
Second important point, was limiting the amount of things you need to memorize. We wanted to make sure that if you understand match coding, you will be able to use our spreadsheets.
To show you how we achieved all this, here is an example formula that will count all perfect receptions from your team:
=VSCOUNT("*R#")If you code matches this should be pretty much self explanatory.
Powerful
One of the advantages of VolleyStation is the ability to use advanced filters to get precise reports, without the need to add extra custom codes. That’s why we added point advantage, player position and many other filters, to our standard reporting. We are happy to inform, that when you create your custom reports in spreadsheets, you will be using the exact same filters. Going custom, will not require you to compromise. As expected, those filters can be mixed together for very precise results.
Visualised
Proper data presentation is key to it’s understanding. VolleyStation Spreadsheets allow for many ways to change data into graphical information.
We have simple mechanisms, like conditional formatting, which can help in highlighting problem areas.

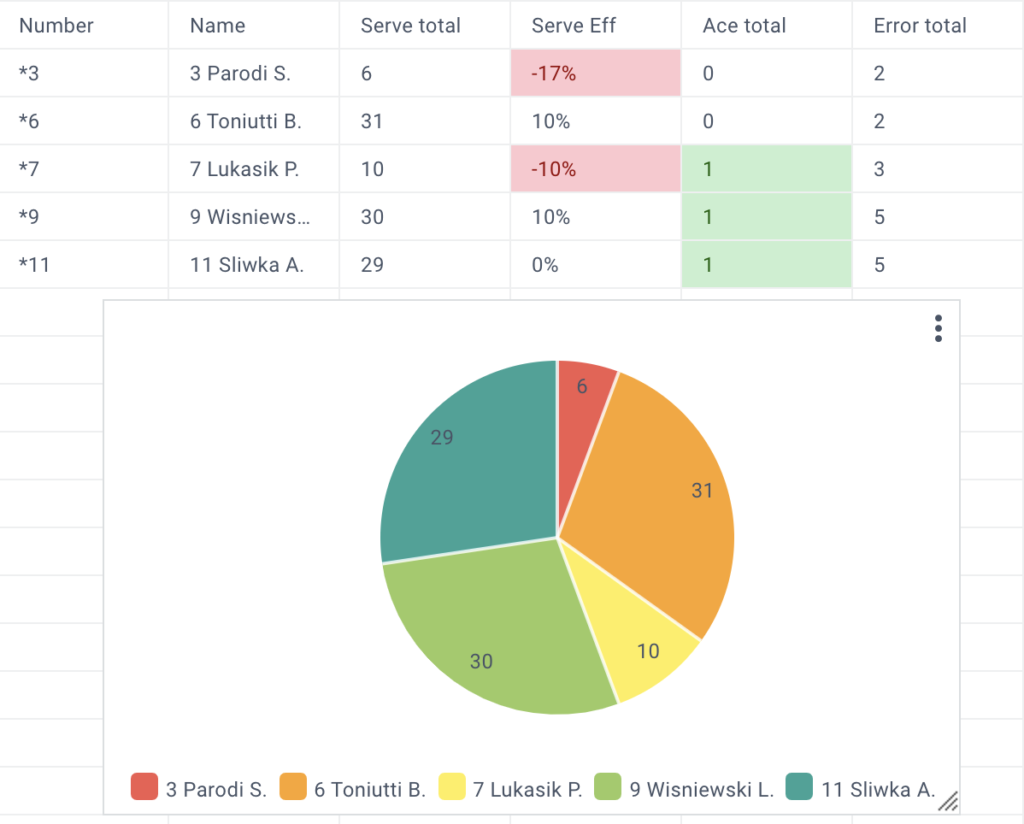
All your data can also be displayed on series of charts, like bar, line, pie or radar. This works great for comparison between players or rotations.
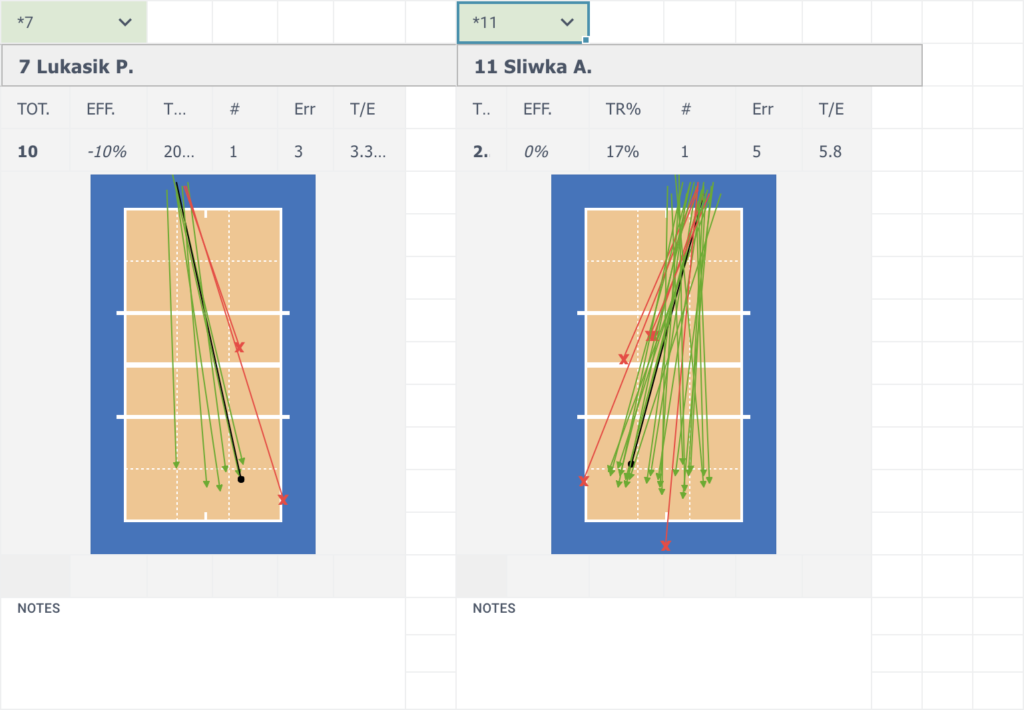
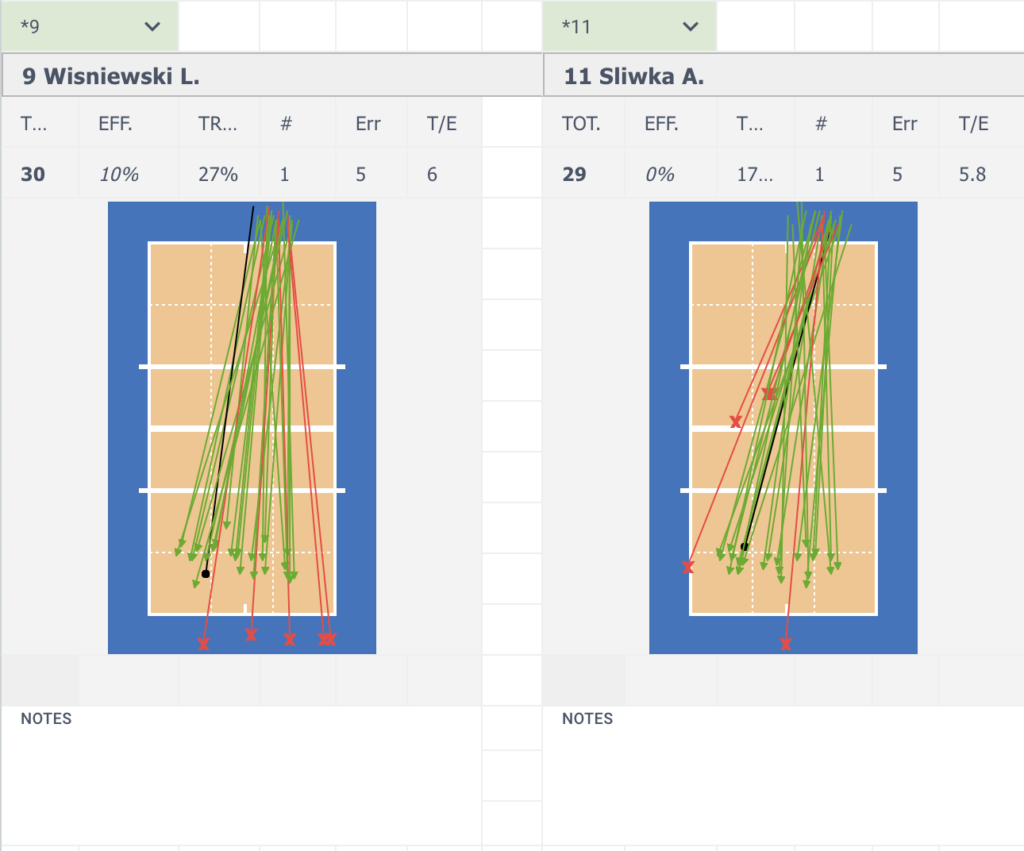
Finally we have special formula that instead of numbers, returns courts. Using it you can set up advanced direction analysis right in your spreadsheet.
Dynamic
In VolleyStation there is no distinction between creation and generation of spreadsheets. Every change to you functions will result in immediate change to your data. This is also true for changing the matches your spreadsheet works with. Every time you change season, team, or match range, your spreadsheet will change accordingly. This works very well for comparisons.
We also have a special function for working with players. It looks like this:
=VSPLAYER("*2i", "libero")This function will fetch second libero from home team roster. It’s a great tool for making fully dynamic spreadsheets, that adjust everything automatically on team change. We strongly suggest using VSPLAYER instead of player numbers.
Basics
Now that we know what are the possibilities of our spreadsheet module, let’s go through some basics of how to create them.
First thing that you probably noticed when opening a new spreadsheet is the match picker up top. For your spreadsheet to fill with data, you need to select matches you will be working with. This selection can be changed at any time, and will reload your current spreadsheet.
To work with spreadsheets, you will have to get familiar with four main functions, that will digest your matches into data. Those functions are as follows:
- VSCOUNT – that will return the amount of plays fitting search
- VSEFF – that will return the efficiency of plays fitting search
- VSPER – that will return percentage of plays with this effect, in all plays fitting search
- VSCOURT – that will display your plays on court
The good news is that internals of those functions are almost exactly the same. You can start creating your own function calls with very little to learn. Lets start by counting some plays:
Here is a basic example of function that will count all kills of our team:
=VSCOUNT("*A#")We can easily extend it to only show us attacks of player 12
=VSCOUNT("*12A#")Let’s also change the attack combination to only show X5 attacks
=VSCOUNT("*12X5#")At this point you probably think that those filters look very similar to codes, you would normally type in during the match. This is because they are almost exactly the same. If you can code a match, you can already write those filters.
Not much changes when you want to get efficiency of attacks mentioned above. Just use VSEFF and remove the effect from filter
=VSEFF("*12X5")You can also display those attacks on court using
=VSCOURT("*12X5#")This is of course just a tip of the iceberg when it comes to filters available in VolleyStation Spreadsheets. Learn about all the filters available in next section.
Advanced uses
VolleyStation spreadsheets allow for the same filtering options as regular reporting. Below you can find the list of all currently available filters
- Filtering by any element of play code
- Current home and away rotations
- Filtering plays based on other plays that happened around it
- Home point advantage
- Match result point range
- Set number, or last set
- Filtering by the result or set or rally (won or lost)
- Player on court
- Precise player order
- Selecting subset of matches as data source for particular cell
- NOT filter that will only return plays not matching your criteria
We also have a series of helper functions
- VSPLAYER for dynamically taking players from roster
- VSPLAYERNAME for displaying player names
- VSTEAMNAME for displaying team names
- VSCELL for using values of other cells in your filters
- VSSETCOUNT for getting team or player played set count
All above options are shown in practical examples in the tutorial spreadsheet below. Load it in your VolleyStation to see how to use those filters.
Example spreadsheets
We know that getting into a new system of work may be a bit daunting at first. That’s why we prepared a series of example spreadsheets that you can use as a base for your work. You can look into them for practical examples of our functions, source of inspiration or simply a base for creating your own reports. Each sheet is marked by the level of it’s complexity.
- Tutorial (demo) – Demo spreadsheet with all current system options
- Simple serve stats (demo) – Demo table with serve stats, showing you the basics of creating dynamic tables
- Serve directions (intermediate) – Simple stats and courts for each player you choose
- Summary stats in table (advanced) – Comprehensive numerical report
- Visual attack analysis (advanced) – Drill down attack directions based on series of filters. Below is a short video, showing usage of this advanced spreadsheet.
Summary
With release of VolleyStation Spreadsheets we hoped to satisfy the needs of professionals, who heavily rely on custom reporting. We are certain that this system will provide you with options to do everything you ever wanted to do, and more. This is obviously not the end of work for us. You can expect more additions and improvements coming soon. Those will include:
- Performance improvements for data changes
- Refreshing spreadsheet automatically when matches change
- Allow for spreadsheet access from the bench
- VSVIDEO function for embedding video player right in your spreadsheets
- Heat maps on spreadsheet courts
- Export to xlsx files
- Printing improvements
Changes mentioned in this article, are already available to all VolleyStation users. Just make sure, you are using VS Pro in version 1.9.0 or above. If you want to try VS Pro, then please contact us using the link below.