We’ve been hard at work, over the last few weeks, to finally bring you one of the most requested reporting features. Today we release Heat map report, with advanced visualisations for play directions. Releasing heat maps to VolleyStation users marks another big milestone in our application development. We can’t wait for you to try this out, and tell us how it works for your team!
New ways to analyse play directions
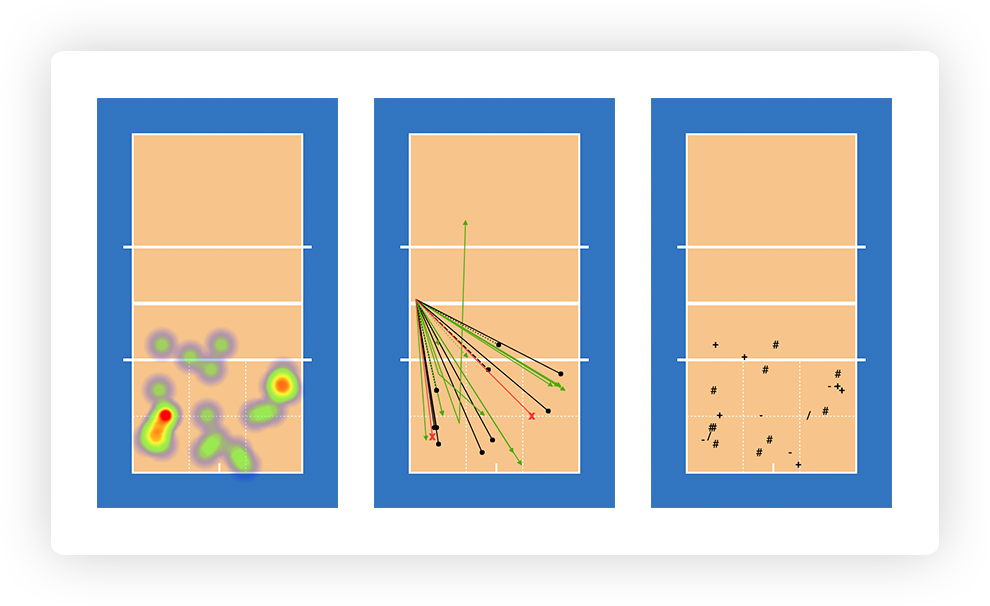
While heat maps are definitely the high point of this release, they are not everything that you get from this new report. We’ve actually prepared a new interactive screen for direction analysis, that offers many data visualisation layers. Those layers can be switched on or off individually. That means that you can use single layer or mix them as you like. Here are the currently available options:
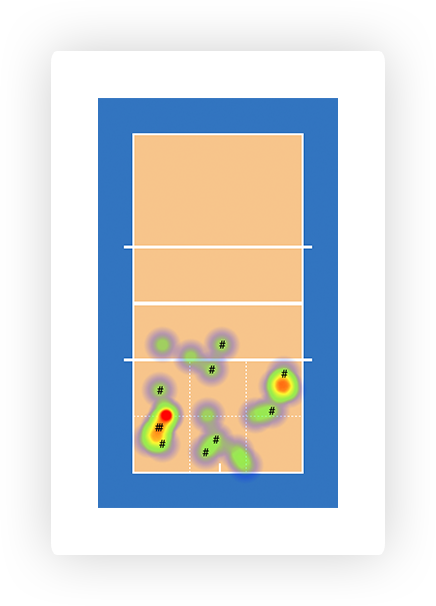
Here you have an example of mixed layers. We display a heat map, together with effects layer, showing only kills.
Let’s now take a bit more detailed look into the capabilities of our new report.
General settings
Heat map report is created in the same as any other report in VolleyStation. You still have all the filters available to you, including our new rotation and players filter. You will notice however, that after entering the report, you have some new options available. They are as follows
- Data – this option allows you to change how your data is split into courts. We currently have three choices: total, by attack combination, and by skill type. Be advised that split by combination works not only for attacks. You can use it when analysing settings as well.
- Visualisation – Select your data layers here. We will talk more about each choice later in this article
- Position – Select whether you want to display visualisation for start or end point. You can also select them both if you want.
- Court style – Use coloured version for better visuals, or no background mode for distraction free, printer friendly reports.
We will now go over all the available visualisation modes, so you can better understand information shown in them.
Heat map
Heat map is definitely the most exciting position on the list. This mode is designed to work with big data sets, of more then 30 plays. Heat map works best as a tool for finding trends that may otherwise be lost in numbers or more precise arrow mode.
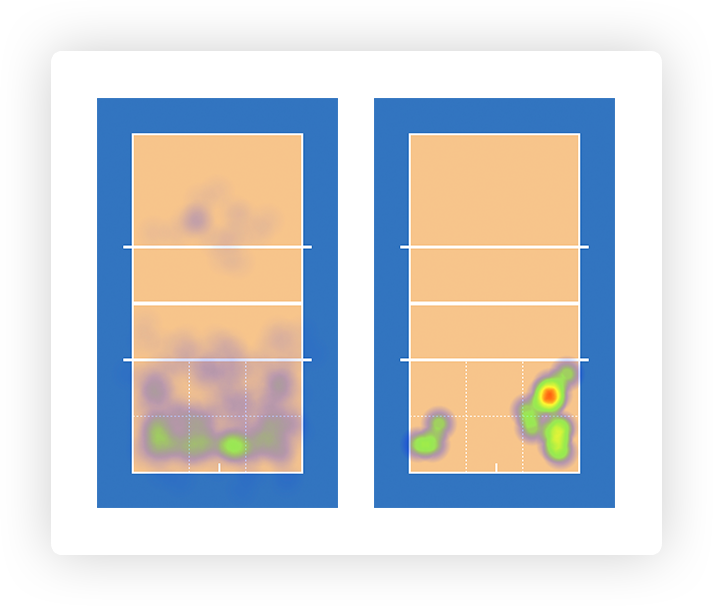
Heat map shows density of you data (for example attack end points) on a colour scale from blue to red. Blue means low attack density, and red means high attack density (strong trend). It’s important to remember that not every heat map will have red spots. If player distributes their attacks evenly across many directions, you will end up with a mostly green heat map. That should be simply read as “no trend”.
Below you can see two examples, one with even distribution, and another with stronger trend present.
Arrows
Arrows is a mode more suited for smaller data sets, of less then 30 plays. It is however more precise than heat maps, and carries more information. When using arrows you will immediately see that they come in three varieties:
- Black arrows with round endings – they indicate kills or good quality plays, like positive or perfect receptions.
- Green arrows with triangular endings – they indicate that exchange continued.
- Red arrows with “X” marks – indicate point loss for the team.
Effects
Last visualisation we have is effects mode. Effects simply mark play effect in selected point, end or start. Effects can be enabled or disabled as needed, and work very well with heat maps. Usual combination is overlaying kills over heat map to see if they have similar distribution.
Heat map prerequisites
To be able to generate heat map reports you must first map precise start and end points for your plays. This is done using special court in match correction mode. Heat map reports will not work using just zones and subzones, as they do not offer enough precision.
If you are a user of VolleyMetrics by Hudl, we have some good news for you. Matches prepared by this platform have all plays already marked and ready for analysis. All you need to do is export your matches as dvw files, and import them in VolleyStation. Be advised that matches imported on versions lower then 1.8.0 will not work with heat map reports, as start and end point import was not yet implemented back then. Those matches will have to be imported again.
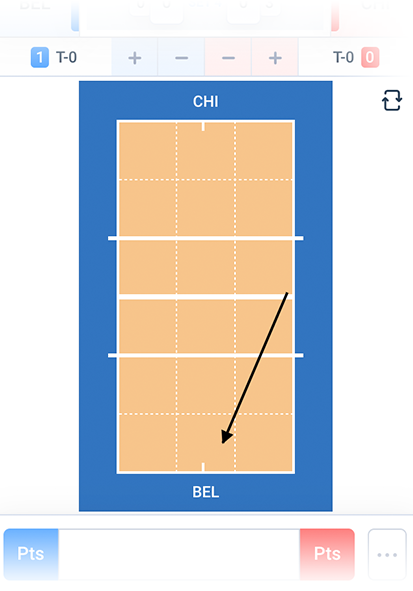
Marking plays
If you are not a user of VolleyMetrics by Hudl, or you have some unmarked matches from other sources, you will have to go through play marking process. Steps of this process are as follows:
- Open the match you want to mark
- Switch the match to correction mode, using the sidebar on the left
- Notice the empty court that appeared in bottom left of the screen
- Rotate the court until team short codes matches team side on the match recording
- Select the play on the play-line
- Draw the arrow on the court, by pressing and holding your left mouse button.
Marking plays may appear to be a time consuming process but you can use some of the already existing VolleyStation features to make it quicker:
- Use arrow navigation to jump quickly from play to play
- Use search to highlight only the plays that interest you, and then jump between them quickly using shift + up / down arrow
- Press F to move video to selected play
Using features mentioned above will speed up the marking process significantly.
VolleyStation will also automatically mark plays for you when it can guess the points from surrounding plays. For instance if you mark serve and the following opposite team setting, we will set reception points for you. That means you only really need to mark serves, attacks and settings for usual exchanges. remaining plays will be filled automatically.
Heat maps summary
We are really excited about this release. Heat maps were always something that many teams wanted to use, but couldn’t due to poor support from existing tools. Opening the option to create those reports for every team will make a big impact on their strategy and planning. We can’t wait to see what you will do with this new tool!
Changes mentioned above, are already available to all VolleyStation users. Just make sure, you are using VS Pro in version 1.8.0 or above. If you want to try VS Pro, then please contact us using the link below.