VolleyStation Report is a series of five spreadsheets that allow you to summarize the season or a few games and analyze the team’s performance. It gives a lot of information, and you can conduct a detailed analysis of team performance and each player.
Each of these spreadsheets contains the first organizing sheet that influences the rest of the spreadsheet. You can find the numbers and names of players of the analyzed team and a list of games and visualization choices if necessary. The “show on video” function in this report is not available yet, but it shows you many numbers and graphs that help you analyze the team.
You can download the spreadsheets here.
HOW DOES IT WORK?
I. VS Report 1 (Summary + Serve)
In the first sheet, you can find all the players’ names and numbers that change when you choose the season, team, and games you want to analyze. In the orange cell (F2), you can put the number of games you want to study. After that, you get the list of the games and opponents below. Then in dark orange cells (I2 and J2), you can choose the visualization style for each court in the whole spreadsheet. Moreover, in the second sheet, “Legend,” you can find all the necessary information about how to read the entire report.
In the “Intro” sheet, you can see the analyzed team’s game list. In the first table, you can see the opponents, the score of the match, and the results of particular sets. The second table contains opponents and rotation for each set. Letter S means the analyzed team served first, and letter R – means they began that set with passing.
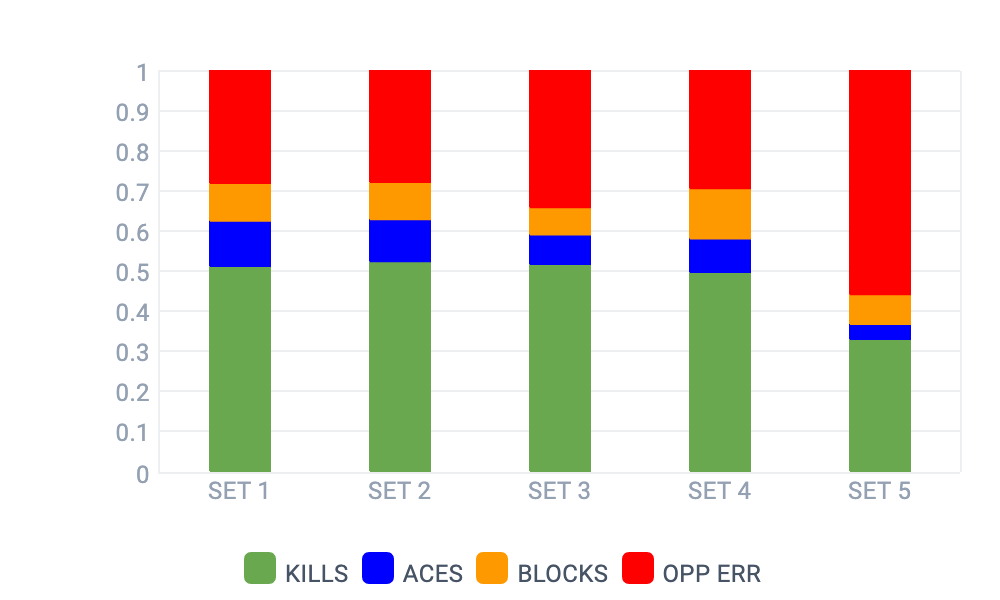
The “Team Summary” sheet contains detailed information about team performance. There you can find pass and attack percentages filtered by won and lost sets. There is also a breakdown of points scored by teams in each set.
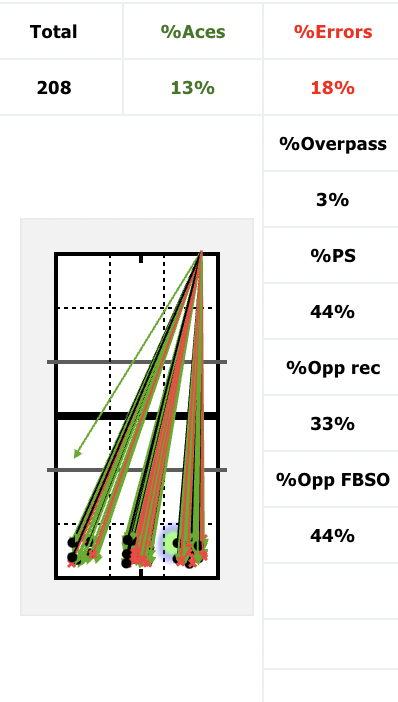
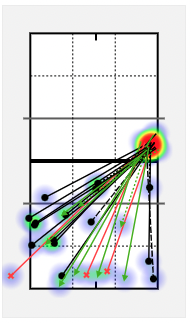
The “Serve directions” sheet presents directions and basic statistics about players’ serves: total serve attempts, the percentage of aces, the percentage of errors, and overpasses. Here you can also find the rate of points won after serve, the percentage of the opponent’s positive reception, and the efficiency of the opponent’s first-ball attack after the reception. It allows analyzing the directions and efficiency of the serve of every player in the team.
The next sheet, “Serve analysis”, contains a table with the serve type. You can see how many serves were type jump, jump float, and float, and the efficiency. This sheet also includes data about the player’s first, second, and third serve. It allows us to see how many serves in the row the player performed, the efficiency of the serve, and how many points the team won after their serve.
The “Line-cross serve” sheet includes information on serve in all games and in the red zone. The red zone is when a team is above 20 and within 2 points of the other team.
Here you can see the explanation of how to read the zones in this report:
| 1 TO 1 | Serve from zone 1 or 9 to zone 1 or 9 |
| 1 TO 6 | Serve from zone 1 or 9 to zone 6 or 8 |
| 1 TO 5 | Serve from zone 1 or 9 to zone 5 or 7 |
| 6 TO 1 | Serve from zone 6 to zone 1 or 9 |
| 6 TO 6 | Serve from zone 6 to zone 6 or 8 |
| 6 TO 5 | Serve from zone 6 to zone 5 or 7 |
| 5 TO 1 | Serve from zone 5 or 7 to zone 1 or 9 |
| 5 TO 6 | Serve from zone 5 or 7 to zone 6 |
| 5 TO 5 | Serve from zone 5 or 7 to zone 5 or 7 |
II. VS Report 2 (Reception 1)
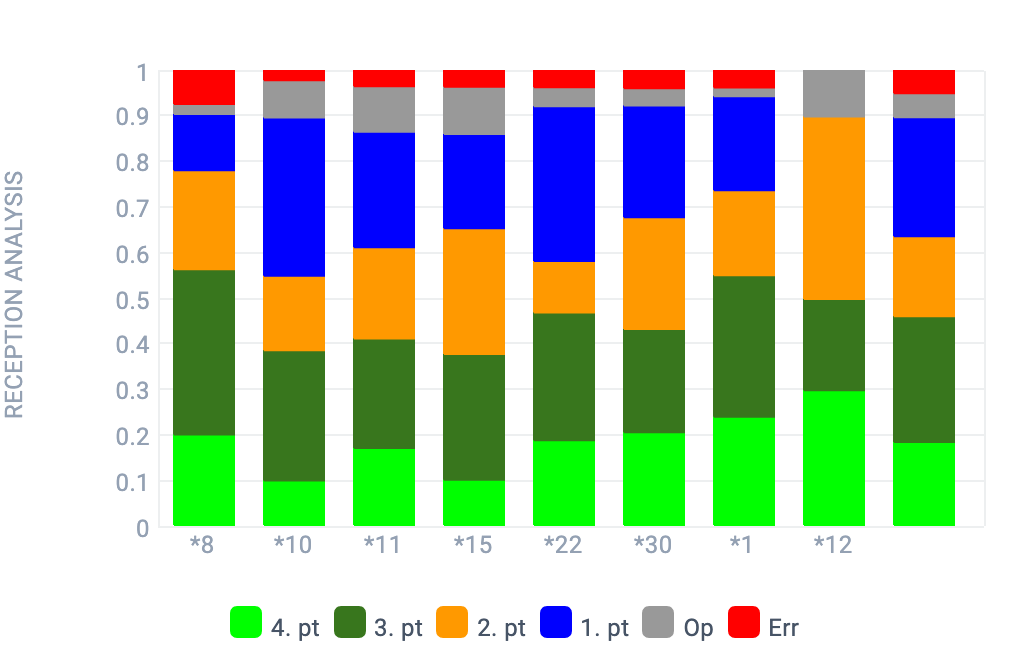
In the “Reception analysis” spreadsheet, you will find the passing breakdown by player and rotation. Here we use four grade scale to evaluate the reception:
- 4 pt – perfect pass (#)
- 3 pt – positive pass (+)
- 2 pt – neutral pass (!)
- 1 pt – bad pass (-)
Good pass here is the reception with #+ effects. Op means overpass and err – reception error.
In the “Line-cross reception” sheet, you will find reception breakdown by line-cross serve, allowing you to analyze whether the passing player was more effective while receiving the line or the cross serve. You can also see in which zone the passing player had the best reception and where he struggled.
III. VS Report 3 (Reception 2)
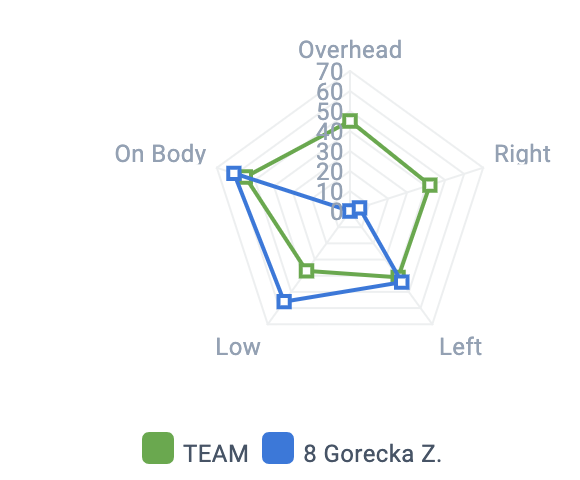
The second passing spreadsheet shows us graphs of the passing players’ efficiency by the reception type. The blue lines show the player’s efficiency, and the green ones – show the team’s efficiency.
IV. VS Report 4 (Distribution)
The distribution spreadsheet is built from three sheets. In the first one, “Distribution,” you can see the distribution of a particular setter in total, the first ball after the reception, transition, in the red zone, and during the set or match point. The effect of reception filters side-out (perfect (#), good (+), perfect and good (#+), medium (!), and bad (-)). Transition is broken into dig and free ball. Each court is built of six segments.
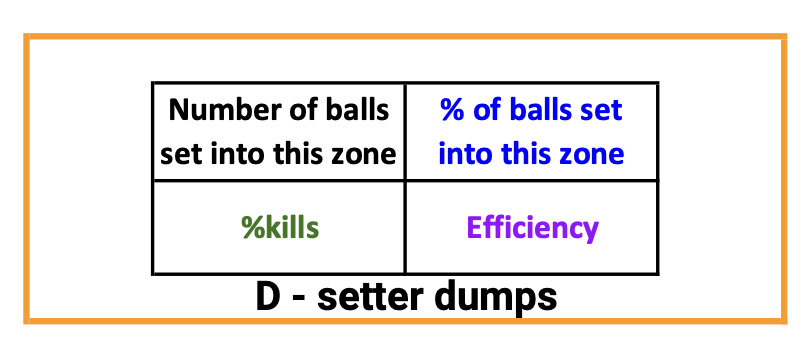
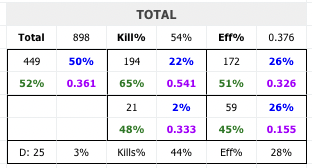
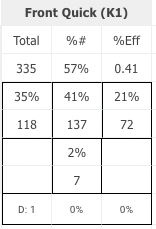
In each element, there are four pieces of information:
- the black number shows how many balls were set into this zone,
- the blue number is the percentage of balls set into this zone,
- the green number shows %kills,
- the purple number gives efficiency.
Below the court is the number of setter dumps, percentage of them, %kills, and efficiency.
Then we have the breakdown by rotation and by the setter.
The “Setter calls” sheet contains information about the setter distribution break by setter calls, rotation, side-out, and transition phase.
In the “Repetitions” sheet, you can analyze the behavior of the setter at a particular moment on the court. For example, does he repeat the ball to the player who made a mistake in the previous rally?
V. VS Report 5 (Attack).
This part of the report includes attack directions of the particular players sorted by positions and combinations. In the first sheet, you can choose the visualization form.
In the “Attack combinations” sheet, players’ efficiency is filtered by attack combinations. This breakdown lets you analyze the amount and efficiency of players when they attack from various combinations. The last sheet shows you the comparison of setters, how often they play, which type of combination, and how efficient their attacking players are from each of them.
All these spreadsheets combined give a complete analysis of the team’s performance and provide useful information. Using this report, you can analyze each skill for each player on the team. You can see serve and attack directions and get all data for these elements. Moreover, you may analyze the setter distribution. This allows you to get all the information you need about your team’s performance and the opponent’s team so you can prepare for the game against them.