VolleyStation features a very robust system for creation of custom spreadsheets. Those spreadsheets are great when working with aggregated data like play counts, efficiencies, or heat maps.
For some time now, we were working on an extension to this system. Our aim was to allow you to view details of single plays, while maintaining deep filtering capabilities of our spreadsheets. Today’s release is the result of this work.
Basics of play by play analysis
To better understand the capabilities and purpose of this system, let’s analyse an example data that we can get out of it.
03,10,08,22,08,22,22,22Those are player shirt numbers, for all those players that performed a spike, in the last points of first set. As you can see, numbers are repeating themselves, and that’s because they represent each attack in sequence.
10,10,08,10,18,22,13,10,18,10,10,10,03,10This second block is the same data, but for different point range. Here we got all the attacks between 10th and 20th point. As you can see, the ratios of players attacking are different between those two sequences. This difference may have been lost when aggregating data, but with play by play analysis, it’s easy to spot.
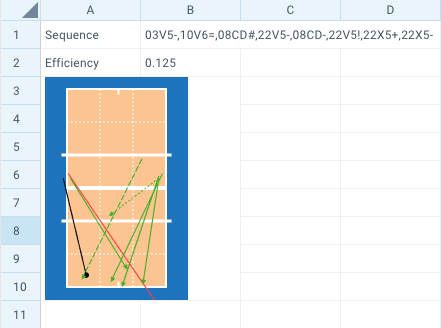
03V5-,10V6=,08CD#,22V5-,08CD-,22V5!,22X5+,22X5-Your sequences are not limited to one piece of data at the time. Here we have the same sequence as before, but with attack combinations and effects. We can pair this with already available functions and courts, to create a neat, quick analysis like this:
New spreadsheet functions
To be able to create the reports above, we’ve added some new functions to our spreadsheet module
- VSPLAYS – This function is similar to
VSCOUNT, and can already be used as a replacement for it. In scope of play by play analysis, it’s the source of data for our play sequences. - VSRANGE – We can limit the sequence length by using
VSRANGE. Further in this article we will show you how to do an advanced play by play analysis, that bases itself heavily on this function. - VSMAP – Limiting play code, to only desired values is done using
VSMAP
The complete code for the example from previous section looks like this:
=VSMAP(VSPLAYS("*A;PR20:*;S1"),"player,combination,effect")Here you can see VSPLAYS being the source of data for VSMAP. VSMAP then translates each play into player number, combination and effect. Outside of those new function names, filtering remains unchanged compared to what you used before. Below is the list of all the details VSMAP can get out of each play:
- team
- player
- skill
- hitType
- effect
- combination
- targetAttacker
- startZone
- startSubZone
- endZone
- endSubZone
- skillType
- players
- special
- custom
Be advised that not all fields have to be present for each play.
Advanced analysis
We’ve mentioned before that more advanced play by play analysis options are available when using VSRANGE. Let’s go over an example of that.
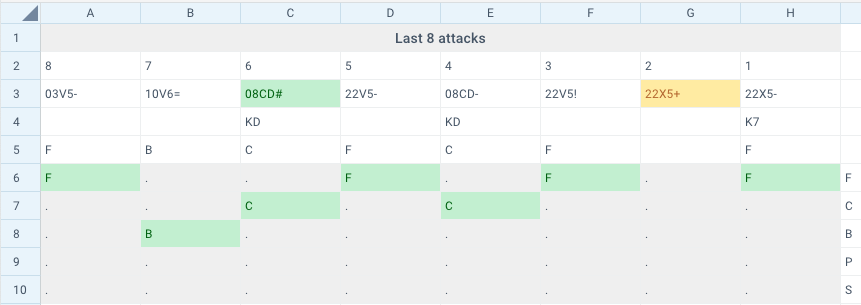
Here we have a table, that focuses on the same 8 last attacks as examples before. This time however we split those attacks in cells, allowing for some better data display, and conditional formatting.
First row contains attack indexes from 8 to 1. We will use those values later, to make our spreadsheet more dynamic.
Second row is composed of functions following this syntax
=VSMAP(VSPLAYS(VSAND("*A;PR20:*;S1","*E;B-0"),VSRANGE("8:8L")),"player,combination,effect")This function is the same function we analysed before, but this time it’s using additional VSRANGE("8:8L") fragment. This fragment will limit the amount of plays we feed into VSMAP for display. VSRANGE can take many different parameters:
- 1:5 – We take first 5 plays from all matching the filters.
- 1:5L – We take 5 plays again, but this time from the end of the list.
- 3:3 – Take takie third play from the list.
- 5:* – We take all plays but skip first 4.
By using ranges including just one attack, we managed to get their data separately in each cell.
Rows 4 and 5 are also using VSMAP, but instead of displaying attack data, we display data for setting. This allows us to analyse not only the attack itself, but also the proceeding setup. In this case we show setter call and target attacker.
Rows 6 to 10, contain the same information as row 5, but we spread the values a bit, making it easier for you to spot any target attacker patterns.
This example is of course just a simple base for you to start learning the capabilities of those new tools, and craft solutions that fit the requirements of your team. More advanced usage of play by play analysis will be showcased in a form of new default spreadsheets, bundled with every VolleyStation installation.
Example spreadsheets
Below you will find two example spreadsheets used in sections above. Those are a great starting point if you wish to better understand how to utilise new spreadsheet tools.
Basic play by play example and Advanced play by play example.
We are also working on a series of new full featured spreadsheets, that mix some of our current features with play by play analysis. Here you can download the first example. Others will be released in the coming weeks.
Give it a try
Changes mentioned in this article will be gradually released to all VolleyStation Pro users. If you can’t wait, you can download VS 1.24 from your user panel. If you want to try VS Pro, then please contact us using the link below.