In this tutorial we will explain how to use data and statistics to improve your teams reception efficiency. We will give you a complete and reusable framework for analysis, that you can apply to match at any level. With time, as you get more and more comfortable with stats and reporting, you can expand on this framework. You can also adapt it to your team or club specifics. We aim to provide you with a functional starting point that will work great, even if you never used statistics before.
To be able to effectively follow this tutorial you will need a fully scouted match, together with video synchronization. Scouting with zones is recommended, but not required.
Main objectives of doing statistics
In general, data analysis can help you answer the following questions:
- What is our current performance level?
- Is our performance going up or down?
- What are the weaknesses and strengths of my team
- Is there a variance in skill level between my players
When you are constantly scouting you matches you can keep answering those questions quickly and with certainty. This allows you to work more efficiently, and be a better coach. It will also win you matches. This is the reason why every professional team spends a lot of time with numbers. Doing stats works, and in this tutorial we will show you why, using reception analysis as an example.
Why you should use statistical software
You may be asking yourself why you should do stats using special software, or maybe, why you should do them at all. In the end you are with your team all the time. You see every match, and every practice. Here are a few reasons
- Statistics are not biased – Regardless of current score, be it 4:7 or 25:26, stats will value every play the same.
- Math gives you precision – Answers you get, are always on point with result being tangible. You will leave words like “poor” or “some” behind. With stats you get results like “this player finishes 37% of her attacks”
- Statistics are quick – You no longer have to re-watch entire match to get basic feel of how your team did. Stats give you answers in few seconds. In situations that are more complex you can use video analysis to supplement them.
- With statistics, you can work on bigger data sets – Sometimes one match is not enough to see certain problems or patterns. With statistical software you can run the same report on 5 matches or 10 practice sessions and get your results as quickly.
Doing stats with software improves quality of your work. You get better answers, quicker. You can point towards problems with your game, and improve faster. Using software also allows to delegate scouting matches to other people and work on data they provide. This makes you spend less time on analysis, not more.
What can the numbers tell us about reception
Now, that we understand general concepts behind data analysis in volleyball, let’s move to working on our reception.
If you’ve ever scouted a match in VolleyStation, you will be familiar with play effects. Effects tell us about direction the game went after each play. They also have a bit of quality assessment built into them. In VolleyStation reception can have following effects:
- Perfect (#) – Ball is passed to a setter in best way possible. It arrives at right height, speed and position. Setting is easy, and all attack options are open.
- Positive (+) – Similar to perfect reception, but not all things are the way they should be. Ball position requires setter to move a little. This results in some attack combinations being difficult to execute.
- Poor (-) – Ball is not sent even remotely close to the net. Setter needs to work overtime to set ball after poor reception. This reception usually excludes possibility of attacks from the center.
- Return (/) – Ball is sent back to your opponent.
- Error (=) – Your team loses point.
Most basic analysis of reception would be looking at amount of every reception effect, for every player, and team in general. For this, some types are more important than others. Errors are possibly one of the most important single reception stat.
Additional info: some coaches use additional effect for reception marked as “!”. It’s not a part of standard effect set, so we will ignore it in this tutorial.
Reception efficiency
Looking at amounts of each effect can be confusing, and create problems when comparing players. That’s why in statistics you usually use one number to describe reception performance: efficiency.
Efficiency is an aggregated number that can be calculated for every play, however each play has its own formula. For reception it looks like this: (perfect + positive) / (all). Result is usually shown as percent. For instance for player who performed as follows: 2=, 4-, 1+, 1# total efficiency would be calculated like this
(1 + 1) / (2 + 4 + 1 + 1) => 25%
Efficiency is a more manageable statistic. It makes it easier to interpret historical data, and set performance bars for players.
Big question, you are probably asking, is “what level of reception efficiency can be considered good”. Unfortunately there is no universal answer for that. It depends on many factors like age group you are coaching, their skill level, individual performance and many others. For this tutorial, which will focus on junior female teams, we will consider anything below 50%, as something that needs attention.
Statistical tug-of-war
If you are working with VolleyStation, and use cards as your scouting method, you probably realized that reception effects are something you never really explicitly selected. That is a very good observation. When scouting, you only select effect of serve, effect for reception is then filled automatically. This is based on a very strong connection between serve, reception and their effects. Good serve is the one that leads to poor reception. Good reception follows poor serve. We do not evaluate those plays separately. This results in few facts of life that you have to keep in the back of your head.
- Your reception efficiency is going to vary significantly based on your opponent. It is difficult to track progress across matches with different opponents. Scouting practice matches is much better in this regard.
- Opponent serve analysis is very useful when trying to pinpoint problems with your reception.
- Drop in reception efficiency may not indicate drop in performance. It’s possible that you faced against strong opponent. Difficult matches result in poor statistics, even if both teams can be considered good.
Above rules hold true not only for serve and reception, but also for attack and block, or attack and dig.
Step 1. General team performance
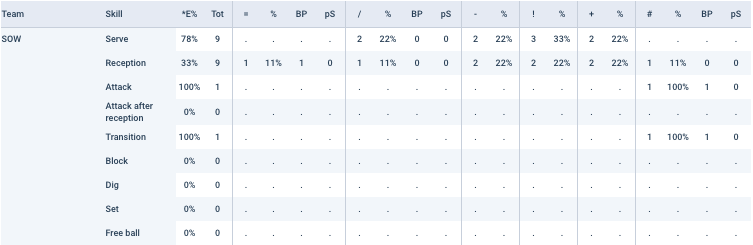
Now, that we have theory out of the way, we can get into analyzing reception. First step you always take is creating general reports for your entire team. Lets take a look at report “by skill” for our example team “Southern Wind”. We played a match against a better team: “Northern Lights”, and lost 0:3.
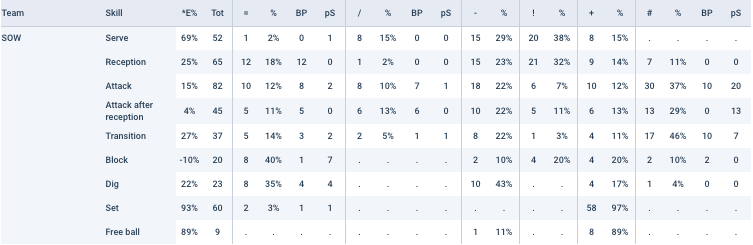
As you can see our reception efficiency is very low. It sits at 25% with 12 points lost during entire match. It probably won’t surprise you if I say that our opponent had 77% serve efficiency, and scored 12 aces. That means 16% of all their points gained were gained from aces.
Let’s take a look at a part of match report. It’s another general report we have, but this one splits some of the data across players.
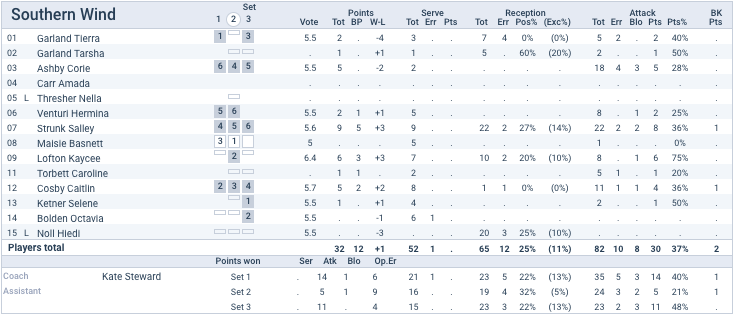
When looking at players, remember to not take into account people who had only few receptions. Such data is not really statistically relevant. In print above we should focus on players 7, 9 and 15. Player 1, while having only few receptions, scored disproportional amount of errors. This may be concerning enough to warrant additional analysis.
In match report, reception efficiency is shown under column Pos%. When looking at players 7, 9 and 15 we see that their efficiency is quite similar. That means all of our players struggled in this match. We also see similar results across sets. We had no major peaks and drops.
This sort of result often indicates major skill difference between teams. Let’s drill down more to see if this is true. Last report we will generate is report for entire team, but split by rotations. It’s a larger file, so it’s available as a PDF download:
Click here to download rotations report
Looking for variance in data
Let’s dive deeper into this “by rotation” report. If you look at general team reception efficiency, you can see quite a bit of variance there. We have rotations with E% nearing 40%, but we also have one sitting at 0%. This is something we were actually looking for. When doing statistics, last thing you want is situation when you are always close to average. In such situation you cannot really put you finger down on an issue.
Since we now know that there is a major difference in performance between rotations, we can start further investigation. Here are general reasons why some rotations may be doing worse than others:
- Person receiving when in certain rotation, may be doing poorly.
- Maybe there was an overlap between that rotation, and serves by particular good player on the opponents team.
- There may be some other positional issues.
In this situation, just looking at numbers may not help you enough. This is where video analysis comes into play. Let’s see all receptions that happened in rotation Z5. This is the situation where we have 0% reception efficiency.
As a coach or player, you probably have a general idea of what to look for in recording like this. Here are few additional tips from us:
- Look for player on your team that is under-performing
- Look for over-performing opponents
- Pay attention to serve directions that cause trouble for your team
- Pay attention to ball types (high, medium, quick) that cause trouble for your team
You can probably already see some of the boxes above ticked by plays in this montage. When you look at recording of a familiar team, you will catch problems instantly. From here it’s a straight path to correcting those problems through practice.
Role of video analysis in coaching
Video analysis is a great tool. It’s biggest advantage is that it works on every level of play, in both age and skill.
If you are new to sport statistics, we recommend basing your work on video. Use numbers to quickly define problem areas, but dig into those problems using video. This is a very effective combination, that yields fantastic results. It allows you to implement stats with minimal alteration to your current workflow, as well as work together with your players. Watching montages together is a great learning experience for everybody. You can even use them as studying material, on which your players can work at home.
Creating montages in VolleyStation is almost instant when you have a ready match. Refer to this article for more information:
Creating video montages with VolleyStation
Step 2. Player performance
Up until now we focused on performance of an entire team, not giving particular players much attention. But what if you see much variance in efficiency between particular players? How to even make sure that what you see is an actual problem and not bias? Let’s start by generating report “by player” for our entire team. Example print is available below:
Click here to download “by player” report
Since we don’t want to stretch this article too much, we shall pick one player for example analysis. Our pick is “Salley Strunk” since she has decent amount of receptions for analysis. From the start you can see that her reception sits at 27%, which is close to team average. Efficiency of 27% is also way below our threshold of 50%. We need to look around and see if we can find some correlation between her poor performance and some aspect of the match.
Analysis by hit type
First check we can do, is dividing receptions by serve hit type. We will look into three main hit types: high, medium and quick. Below you can see reports by skill generated for this one player and desired hit type.
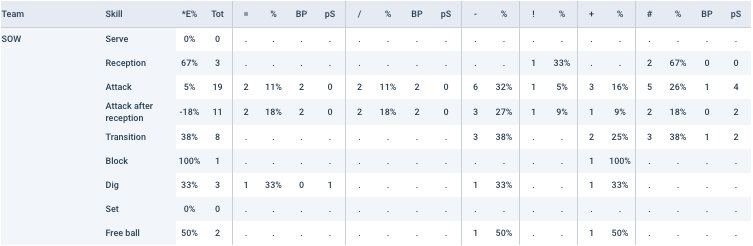
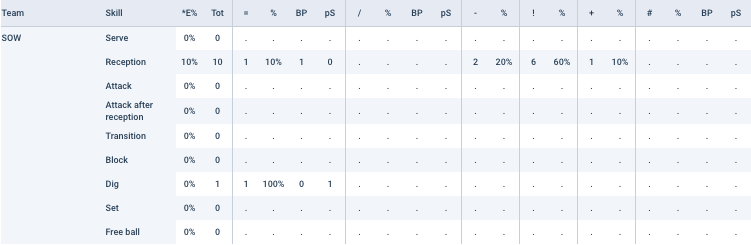
You can immediately see that efficiency level varies between those hit types. Reception of high ball is definitely the best, albeit amount of those plays is low. In such case you may want to hold your judgment and try to run your report over more matches. Besides high ball we can see that quick is where our player performs worst. Efficiency of 10% is definitely not what we are looking for.
Just like with team analysis we did before, you should create a montage of all receptions of quick serve done by this player. This will give you all the insight you need to plan your next practice session and get your player help she needs.
Other possible reports
Above pattern of splitting data can be used over and over, for as many factors as you want. Here are some additional ideas to get you started:
- Check player reception in different rotations
- Check player reception separately for zones 1-5-6 and 7-8-9
- Use video analysis to dig into direction from which the ball was received.
Each time you find a split, that has a lot of variance in it, you should be happy. This means you found a problem, that you can now analyze and fix.
Step 3. Take a look at your opponent.
We mentioned before that our opponent, Northern Lights, had a fantastic serve efficiency of 77%. Let’s see if we can squeeze some more information out of our data. Best way would be to use serve direction analysis. Here is an example report:
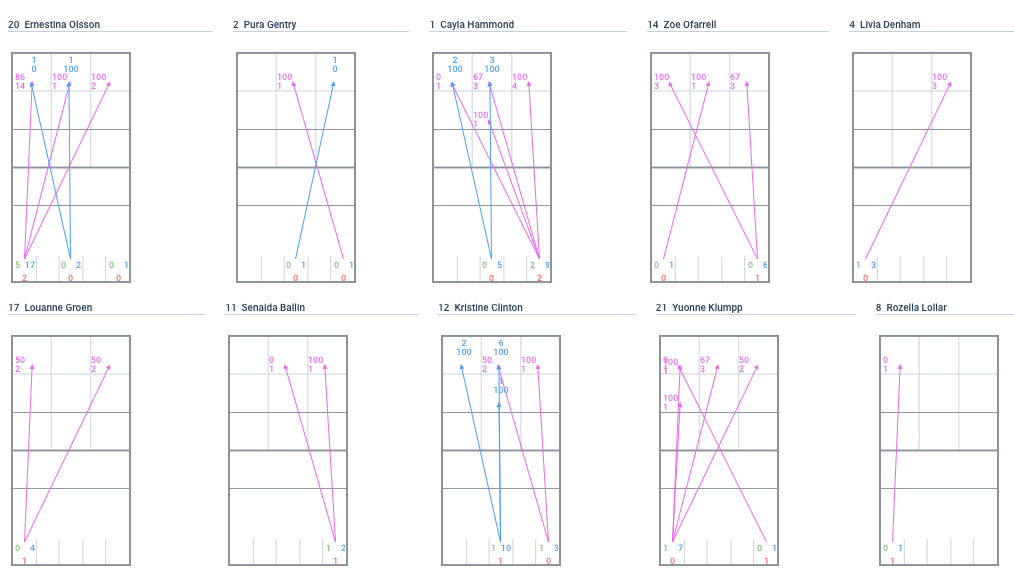
Here we can see all players that served during this match, together with their serve directions, aces, errors and efficiencies. Analyzing this graph will teach you a lot about patterns and preferred serve direction of each player. You can use this information to both improve your team and plan your next match. Knowing those directions will help your libero to position better, and maybe next time you will keep your reception efficiency closer to your target 50%.
Summary
This article covered a lot of material related to reception analysis using both numbers and video. Hopefully now you have a better understanding of why statistics are a useful tool for a coach. Lets quickly go through some key points:
- Statistics are a universal, unbiased and quick way to find problems in your game.
- With statistics, you can be in touch with performance of each particular player.
- Video analysis and statistics can be used at both team and player level.
- Statistics can be used against your opponents.
- Numbers help you find trouble areas quickly. Video helps you understand problems and find solutions.
At the beginning we mentioned that to be able to follow this tutorial you need a fully scouted match. We know that this additional workload is often too much for an already busy coach. That’s why VolleyStation has new scouting method called cards. With cards, any member of your team can take on the scoutman role, and analyze matches for you. Maybe you have a player recovering from injury? That’s a perfect candidate! Read the following article if you want to learn more about scouting in VolleyStation.
Scouting without codes with VolleyStation
Give VolleyStation a try
VolleyStation, is currently available for trial. We would like to invite you to join and share your feedback. VolleyStation is free to use during the trial period. Register today at volleystation.com/register

If you want to learn more about VolleyStation, then please visit our website at volleystation.com

We are waiting for your feedback at contact@volleystation.com